Support & Resistance
Support and resistance are one the key attributes of chart analysis, as it represents key juncture where the forces of supply and demand meet. In simple economic terms when the demand of a given stock is higher the prices are likely to increase, if this demand is not met by sellers. Equally as supply increases, prices are likely to decline. When supply and demand are equal, prices move sideways as bulls and bears fight for control.
It is not rocket science to identify Support and Resistance, and it can be applied to any market, ie Stocks, Commodities or Forex. Chart patterns are bound by support and resistance levels.
What is Support?
Support is the price level at which buyers are expected to enter the market and this will prevent the price from falling further. The market has memory, so as the price declines previous low, buyers become more likely to buy and sellers become less likely to sell. By the time the price reaches the support level, buyers will enter the market in sufficient numbers to prevent further fall in the price and creating a support level.
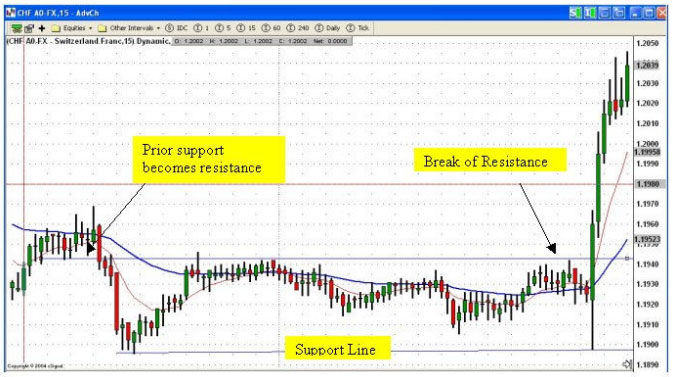
After a support level is penetrated, it often becomes a resistance level; this is because investors want to limit their losses and will sell later, when prices approach the former level.
What is Resistance?
Resistance is when the price stops going up. This is a level where sellers are expected to enter the market in sufficient numbers to prevent further increases in prices, and also a level where the buying interest has decreased significantly. This is a level where supply will overcome demand and prevent the price from rising above resistance.
Once the resistance level is broken, it often becomes a support level;
The concept of SUPPORT AND RESISTANCE is essential in order to analyse the charts. Just as a ball bounces when it hits the floor or drops after being thrown to the ceiling, support and resistance therefore are boundaries for rising and falling prices.
When price pushes above resistance, it becomes a new support level. When price falls below support, that level becomes resistance. When a level of support or resistance is penetrated, price tends to thrust forward sharply as the crowd notices the BREAKOUT and jumps in to buy or sell. When a level is penetrated
but does not attract a crowd of buyers or sellers, it often falls back below the old support or resistance. This failure is known as a FALSE BREAKOUT.
Trendlines
Technical analysis attempts to gauge the strength and direction of a trend, once the trend is in motion it will continue in that direction for some time. Once the trend is determined early, the trend can be followed and more profit can be made.
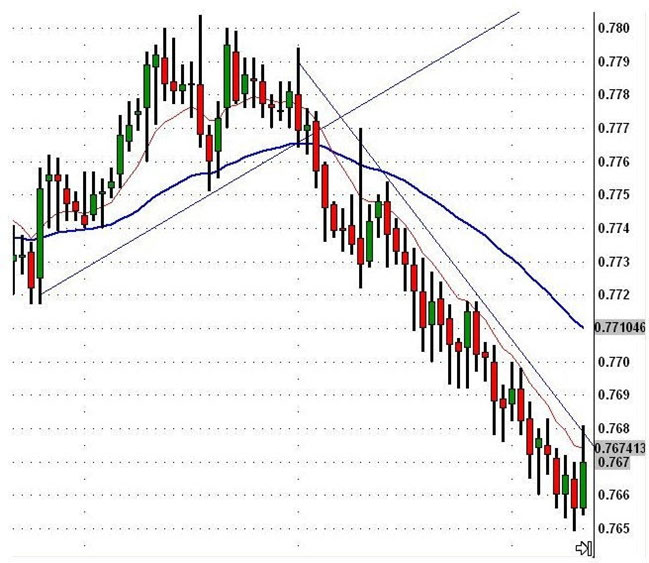
The trend is your friend - Never fight a trend. In the above example of AUDUSD, the break of up trend is followed by a long down trend. The topping of price action is followed by a price break. Apart from high volatility in the Forex market, you will also notice that it also trends well – both giving perfect opportunities to make money.
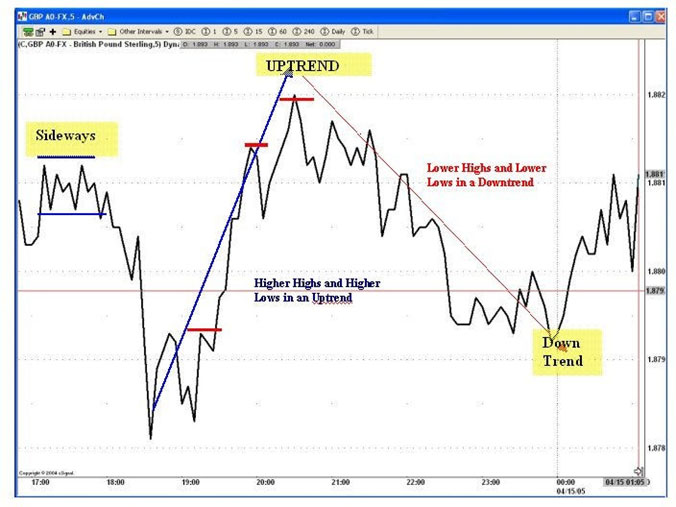
The markets can only move in one of three ways; up, down, or sideways. That’s it. Prices however do not move in a straight line, they move by zig-zagging up- down-up-down, so you will have-
- An up trend
- A downtrend, and
- A sideways movement
These trends are illustrated in the following chart.
Trends happen when traders worldwide believe that a price is either too low – so you will now be in an up trend as you have a buying pressure, or traders feel that the prices are too high – so you will be in a down trend as there is selling pressure. Sideways movement happen when traders either believe that the current price is more or less right, or when they are undecided. This normally happens when there is major news pending, for example prior to release of say Non Farms Payroll data.
The FOREX market trends very well, and that is the main reason why traders love FOREX. If all you knew was how to follow trends properly, then this alone could make you a very nice income. As they say, “a trend is your friend” or never go against a trend! The trendline is the most basic technical analysis, and all traders use it. It is amazing how price repeatedly bounces off the trendline. An up trend will have a series of higher highs and higher lows, whereas a downtrend will have a series of lower highs and lower lows. When you draw a trendline, whether an up trend or a downtrend, so long as prices keep bouncing off a trendline you can keep making money. All trends will eventually end. A good indication that the trend is ending is when the price significantly penetrates through the trend line and takes out the previous low (up trend) or the high (downtrend).
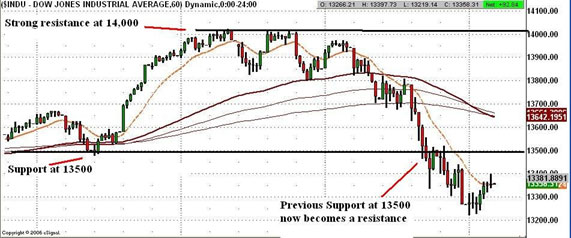
Round Numbers
Often round numbers does act as a strong support and resistance. Often we will see strong resistance at key round numbers, and once this levels are penetrated than this often leads to heavy buying and pushing prices even further. Amateur traders often tend to place trades at these key levels, and also putting stops, this in turn can create a momentum in a continuation of the trend once the stops are hit.
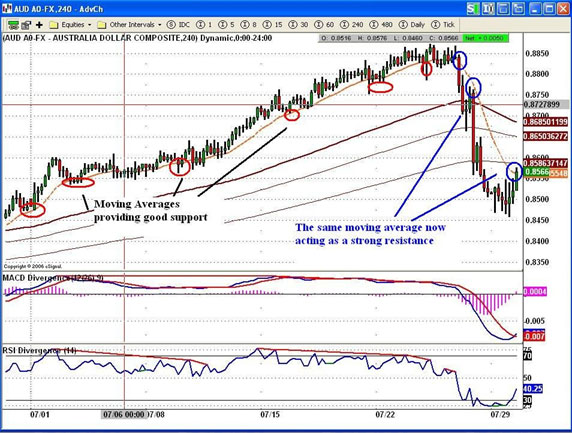
Moving Averages
Very few traders use moving averages as a dynamic support & resistance, those who do use it tend to be successful traders. As can be seen on the following chart of AUDUSD, the 13 EMA has provided a very strong support, and when this EMA has been broken, it has acted as a barrier to price increase.
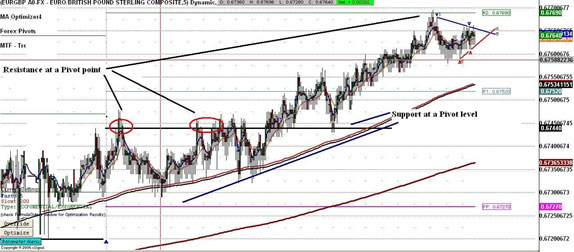
Pivot Points as a Support and Resistance Tool
Pivot points are one of the primary tools used by many Forex Traders, and the average trader does not generally understand them.
Using pivot points as a trading strategy has been around for a long time and was originally used by the floor traders. Pivot points can be calculated using few simple arithmetic calculations, using the previous 24 hour “session” days high, low and a close. A series of points are delivered. These points can be critical support or resistance levels. These Pivots are valid for the next 24 hours, and you have to calculate them on a daily basis.
Pivots are also widely used by the bank and institutional traders, where large part of FOREX volume is based, so I guess they become accurate by definition. Since much of the volume on Forex depends on these techniques, pivot lines then become the focal points for the battles between buyers and sellers. Whilst no system is perfect, but when a trading strategy is devised in conjunction with other indicators or chart formations, Pivot levels can become very powerful
Conclusion
Understanding and the use of support & resistance can drastically improve the results of any trader, as it can enable a trader to forecast where the prices are likely to prop up in the event of a correction or indeed a rally could just stop at a major resistance level, enabling the trader to bank profits and also to consider reversing the position.